
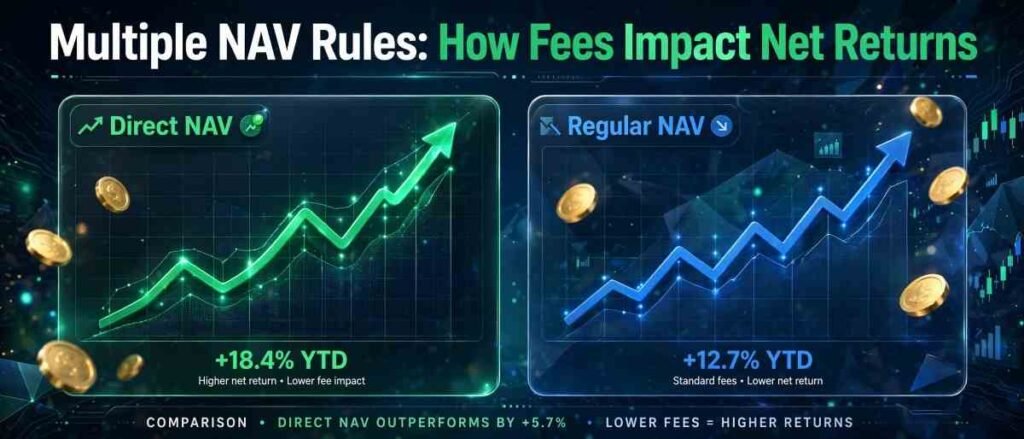
Imagine checking two accounts holding the exact same set of underlying stocks, managed by the exact same fund house, only to realize one is quietly earning a higher return than the other. No magic tricks involved—just the subtle, compounding math of category-wise expense ratios and NAV calculations.
For years, mutual fund investors enjoyed the benefits of “Direct” versus “Regular” plans. However, retail pension investors in the National Pension System (NPS) largely operated under a single Net Asset Value (NAV) model per scheme.
That changed when the Pension Fund Regulatory and Development Authority (PFRDA) rolled out the landmark Multiple NAV framework for NPS. This shift introduced over 110 scheme variants—separating Direct (e-NPS), Regular (Point of Presence), and Government Sector subscribers into distinct NAV buckets.
Understanding NPS NAV calculation rules and how the updated Investment Management Fee NPS 2026 structure alters compounding is crucial for maximizing net returns. Here is a breakdown of how category-wise fees operate across NPS and Mutual Funds, along with strategies to optimize your portfolio.
What Is the Multiple NAV Framework in NPS?
Under the traditional NPS structure, a pension fund manager (PFM) published a single unit price—the NAV—for a specific asset class (like Scheme E for Equities or Scheme C for Corporate Bonds). Whether you joined through a government mandate, paid an intermediary at a bank branch, or registered directly online, everyone purchased units at the exact same NAV.
The issue? Servicing costs, intermediary commissions, and administrative overhead vary drastically across subscriber channels. Blending these expenses into a single NAV meant direct, self-directed investors were effectively subsidizing the distribution costs of intermediary-driven accounts.
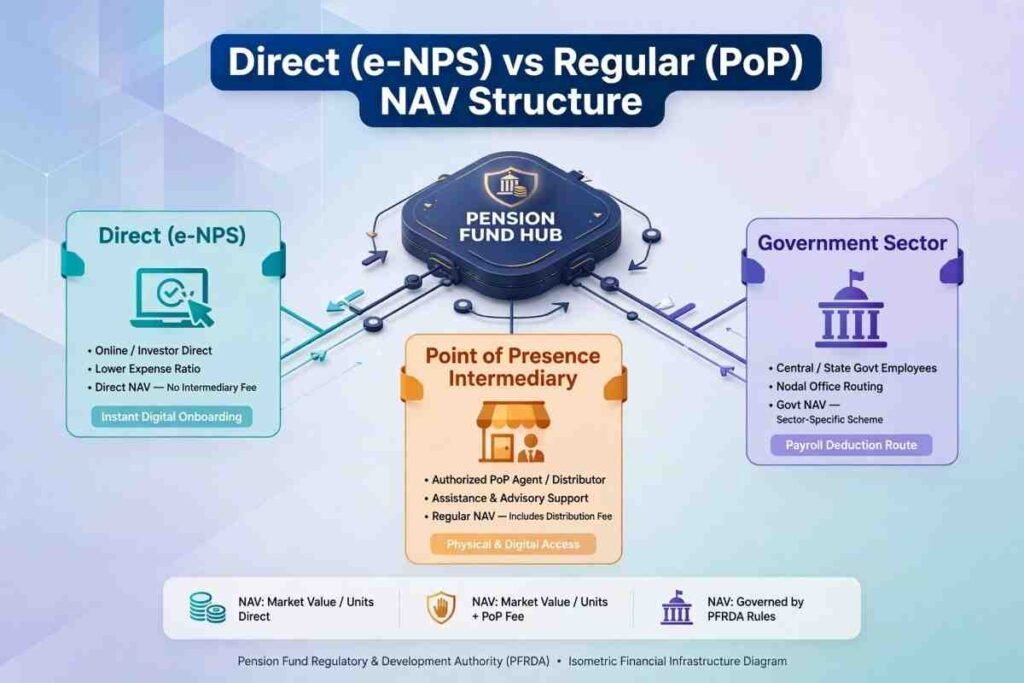
The Multiple NAV framework in NPS assigns distinct NAVs to different subscriber categories based on their entry route and category:
- Direct (e-NPS): Designed for self-directed investors onboarding online through the e-NPS portal or D-Remit. Distribution commissions are bypassed, resulting in lower total expense ratios and a higher NAV growth rate over time.
- Regular (PoP): Applicable to accounts opened or serviced through Point of Presence (PoP) entities like banks or brokers. The NAV accounts for distribution and servicing fees.
- Government Subscriber (GS): Tailored for Central and State Government employees, featuring specialized fee slabs negotiated via institutional mandates.
┌─────────────────────────────────────────────────────────────┐
│                 Underlying Asset Portfolio                  │
│       (Same Stocks, Corporate Bonds, & Govt Securities)      │
└──────────────────────────────┬──────────────────────────────┘
                               │
       ┌───────────────────────┼───────────────────────┐
       ▼                       ▼                       ▼
┌──────────────┐        ┌──────────────┐        ┌──────────────┐
│  Direct NAV  │        │ Regular NAV  │        │Govt Sec NAV  │
│  (Lowest Fee)│        │  (PoP Fee)   │        │(Special Fee) │
└──────────────┘        └──────────────┘        └──────────────┘
Understanding NAV Calculation & Fee Mechanics
Net Asset Value represents the market value of a scheme’s investments minus its liabilities, divided by the total number of outstanding units.
The core equation for daily NAV calculation is:
$$\text{NAV} = \frac{\text{Total Market Value of Assets} – \text{Applicable Expenses \& Liabilities}}{\text{Total Outstanding Units}}$$
When fees are deducted daily prior to declaring the NAV, any variance in the annual Investment Management Fee (IMF) or distribution charge creates a daily drag on the NAV’s trajectory.
NPS Fee Slabs
The PFRDA’s revised slab-based framework links the Investment Management Fee directly to Assets Under Management (AUM). These tiered slabs keep costs low as fund sizes grow:
| AUM Tier | Non-Government IMF Cap | Government Sector IMF Cap |
| Up to ₹10,000 Crore | 0.12% per annum | 0.09% per annum |
| ₹10,000 Cr – ₹25,000 Cr | 0.12% per annum | Decreasing slab rates |
| ₹25,000 Cr – ₹50,000 Cr | 0.08% per annum | Decreasing slab rates |
| ₹50,000 Cr – ₹1.5 Lakh Cr | 0.06% per annum | Decreasing slab rates |
| Above ₹1.5 Lakh Crore | 0.04% per annum | 0.03% per annum |
In addition to the IMF, Point of Presence (PoP) trail charges apply to Regular plans, creating a distinct fee gap between Regular and Direct NAVs.
NPS vs. Mutual Funds: How Multiple NAV Structures Compare

While mutual funds introduced direct plans over a decade ago under SEBI regulations, comparing their fee structure with the PFRDA’s Multiple NAV model highlights key operational differences:
| Feature | National Pension System (NPS) | Mutual Funds (SEBI Regulated) |
| NAV Classification | Direct (e-NPS), Regular (PoP), Government | Direct Plan, Regular Plan |
| Average Management Fee | 0.03% to 0.12% (Slab-based) | 0.10% to 1.50% (Active), 0.05%–0.20% (Index) |
| Distribution Fee Impact | PoP charges deducted via NAV or per transaction | Distributor commission embedded directly in Regular NAV |
| Regulator | PFRDA | SEBI |
| Transparency Level | High (Separated AUM slabs across sectors) | High (Mandatory daily TER disclosures) |
The Math of Compounding: How Small Fee Gaps Impact Net Wealth
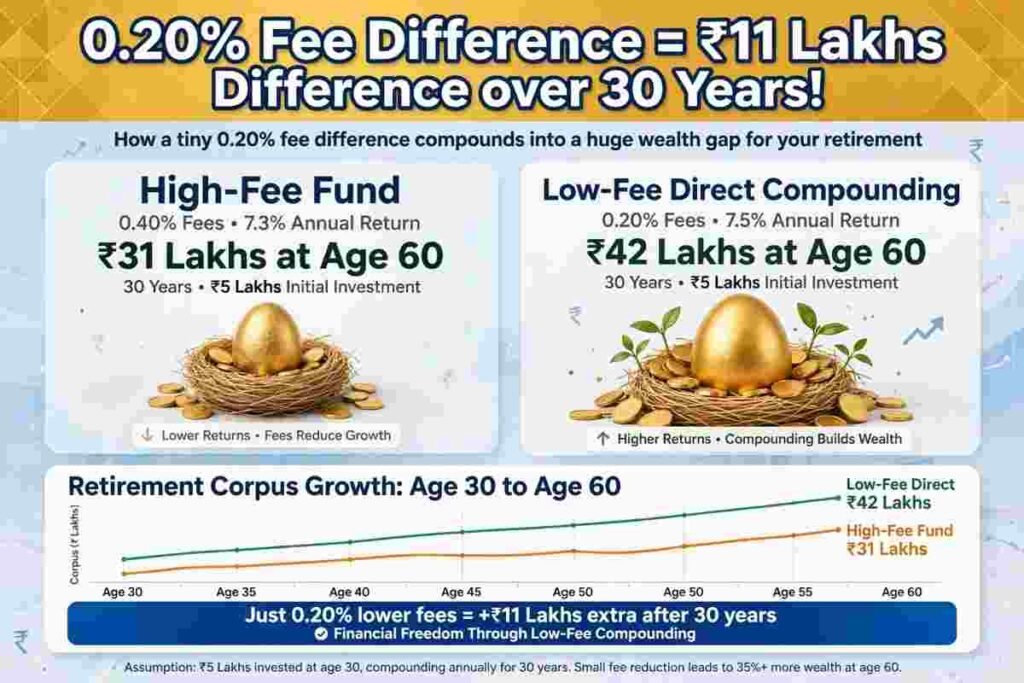
A common oversight among retail investors is treating minor fee differences—like 0.10% or 0.25%—as negligible rounding errors. Over a 25-to-30-year pension accumulation horizon, these small variations compound into significant amounts.
Real-World Case Study
Consider two 30-year-old investors, Rahul and Priya, who each invest ₹10,000 per month into an NPS Equity Scheme (Asset Class E) for 30 years, expecting a gross market return of 11% per annum.
- Rahul (Regular Plan via PoP): Incurs an effective fee drag (IMF + distributor/PoP trail) of 0.25% per annum. His net annual compound yield is 10.75%.
- Priya (Direct Plan via e-NPS/D-Remit): Incurs an effective fee drag of only 0.05% per annum. Her net annual compound yield is 10.95%.
Long-Term Corpus Comparison (30-Year Horizon)
| Investor Metric | Rahul (Regular / PoP) | Priya (Direct / e-NPS) | Difference |
| Total Principal Invested | ₹36,00,000 | ₹36,00,000 | ₹0 |
| Effective Net Return | 10.75% p.a. | 10.95% p.a. | +0.20% p.a. |
| Final Corpus at Age 60 | ₹2.16 Crore | ₹2.27 Crore | +₹11.00 Lakhs |
Key Takeaway: A seemingly minor 0.20% fee difference yields an extra ₹11 Lakhs in Priya’s final retirement pot, simply because less capital was eroded daily by NAV fee deductions over 30 years.
Strategic Action Steps for Investors
To ensure your long-term wealth isn’t quietly drained by avoidable intermediary charges, consider these practical steps:
1. Audit Your PRAN Account Status
Log into your CRA portal (NSDL/Protean, KFintech, or CAMS) and check your account classification. If your investment scheme displays a “Regular” or “PoP” tag and you do not rely on an advisor, you may be paying unnecessary distribution charges.
2. Utilize D-Remit for Direct Processing
Set up a Direct Remittance (D-Remit) virtual account through your bank. Auto-debiting contributions directly into your PRAN via D-Remit bypasses PoP payment gateway commissions, ensuring same-day NAV allotment under the lowest-cost direct route.
3. Review Mutual Fund Expense Ratios Annually
For mutual fund portfolios, regularly compare the Total Expense Ratio (TER) of your holdings against their Direct plan equivalents via AMFI India. Transitioning from Regular to Direct plans can immediately boost your net compounding rate.
4. Factor in Exit Loads and Tax Realizations
Before switching existing mutual fund units from Regular to Direct, evaluate capital gains tax implications (LTCG/STCG) and any applicable exit loads. For NPS, check PFRDA guidelines regarding scheme preference modifications within your CRA portal.
Conclusion
The implementation of the Multiple NAV framework in NPS marks a significant move toward structural transparency in India’s retirement sector. By splitting NAVs across subscriber categories, the system ensures that self-directed investors receive the full benefit of lower distribution expenses.
When managing long-term assets, reducing ongoing costs is one of the few variables fully within your control. Shifting from Regular to Direct plans across both NPS and Mutual Funds helps retain a larger share of your gross returns, allowing compound interest to work in your favor.
What’s Your Strategy?
Have you reviewed your NPS PRAN statement to see whether you are enrolled in a Direct or Regular scheme? Share your experience, thoughts, or questions in the comments below!