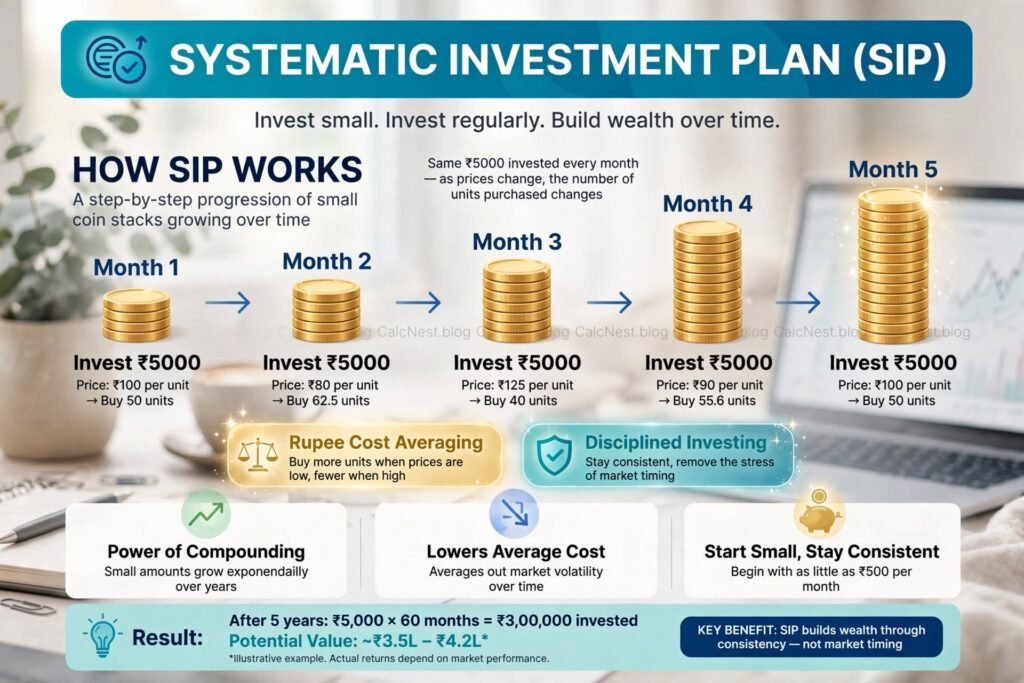

A close friend of mine who actively invests in both US index funds and Indian equities recently pulled up his portfolio dashboard during a casual weekend discussion. For over five years, he had been running a disciplined monthly Systematic Investment Plan (SIP). On paper, he was doing everything right by automating his monthly contributions.
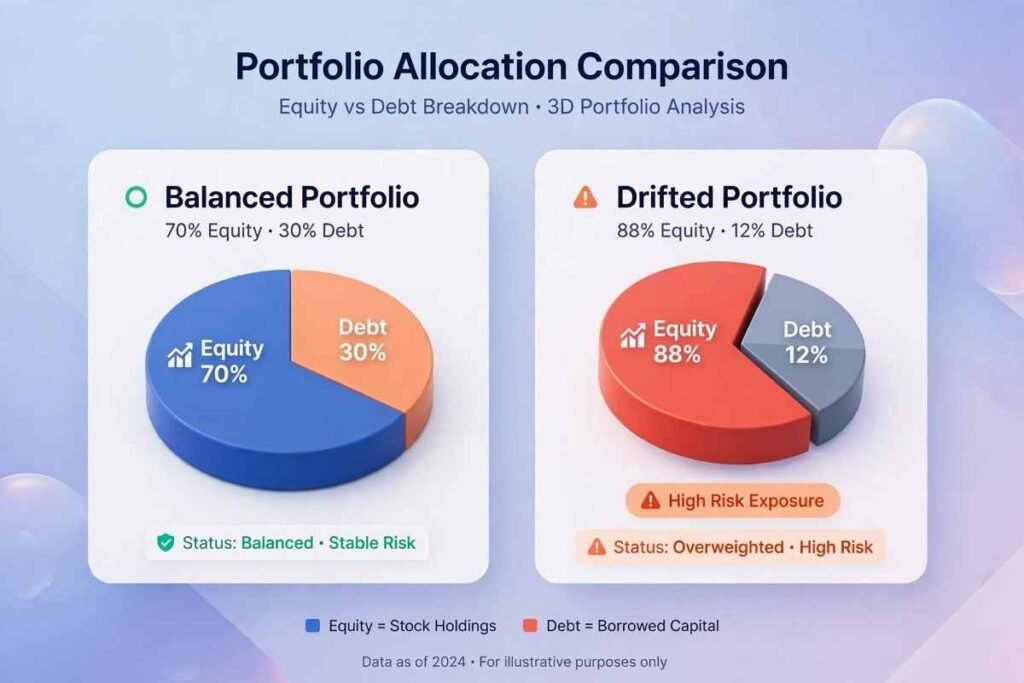
Yet, when we examined his target 70/30 equity-to-debt ratio, we noticed a massive drift. Thanks to a prolonged bull run in mid-cap equities, his actual equity exposure had ballooned to nearly 88%, leaving his total net worth severely exposed to a sudden market correction.
“I set up my SIPs years ago,” he confessed. “I completely forgot that buying every month doesn’t automatically keep my target risk level balanced.”
His situation highlights the critical limitation of traditional wealth building. Standard SIPs are designed to automate capital deployment, but they do not manage dynamic risk. When comparing automated algorithmic rebalancing vs manual SIPs, relying solely on static periodic purchases often forces investors to unknowingly take on excessive market risk. By leveraging modern ai-driven asset allocation algorithms and dynamic rebalancing frameworks, retail investors across the US and India can control equity drift, reduce drawdowns, and lock in long-term compound growth.
Here is an in-depth breakdown of how dynamic algorithmic rebalancing operates, the math behind portfolio drift, and how automated asset allocation transforms cross-border wealth management.
The Core Dilemma: Automated Algorithmic Rebalancing vs Manual SIPs
A standard Systematic Investment Plan (SIP) or recurring automated purchase commits a fixed dollar or rupee amount into designated funds at set monthly intervals. While this strategy successfully enforces saving discipline and leverages rupee/dollar cost averaging, it operates without regard to portfolio weight shifts when comparing automated algorithmic rebalancing vs manual SIPs.
Portfolio Drift Breakdown:
- Initial Target Allocation: 70% Equities / 30% Debt & Fixed Income
- 5-Year Portfolio Drift (No Rebalancing): 88% Equities (High Volatility Risk) / 12% Debt (Inadequate Buffer)
Over multi-year market cycles, asset classes grow at unequal rates. Equities may rally by 20% while fixed-income yields remain stable at 6% to 7%. Over time, your highest-performing assets swallow an increasingly large share of your total portfolio, creating systemic imbalances:
- Unintended Risk Exposure: If equities surge, your portfolio becomes far more volatile than your original risk profile intended, leaving you vulnerable during sudden market sell-offs.
- Loss of Buy-Low, Sell-High Discipline: Standard SIPs keep buying assets based on fixed dollar amounts rather than selling overvalued, overweighted assets to accumulate undervalued ones.
- Manual Rebalancing Friction: Adjusting portfolios manually requires monitoring target allocations, calculating capital gains taxes, and executing multiple trades—a hassle that causes most retail investors to postpone rebalancing altogether.
How Automated Algorithmic Rebalancing Works

Unlike static SIPs that purchase assets blindly every month, automated algorithmic rebalancing vs manual SIPs introduces continuous, data-driven portfolio management.
Instead of waiting for an arbitrary calendar date (like every December 31st) to adjust your holdings, ai-driven asset allocation engines monitor portfolio allocations daily using preset rules.
Key Rebalancing Mechanisms:
- Tolerance-Band (Threshold) Triggering: The algorithm establishes strict tolerance bands around your baseline target weights (e.g., ±5% deviation). If equities target is 60%, rebalancing triggers automatically only when exposure drops below 55% or exceeds 65%.
- Intelligent Cash-Flow Smart Routing: To minimize taxable events, advanced robo-advisors direct new incoming monthly SIP deposits exclusively toward your most underweight asset classes, rebalancing your portfolio without selling appreciated assets.
To calculate your foundational compounding trajectory before evaluating automated algorithms, run your baseline projections on our free SIP Calculator.
Head-to-Head Comparison: Automated Algorithmic Rebalancing vs Manual SIPs
To understand the core operational differences between static dollar-cost averaging and dynamic algorithmic execution, consider the following breakdown comparing automated algorithmic rebalancing vs manual SIPs:
| Strategic Feature | Manual Monthly SIPs | Automated Algorithmic Rebalancing |
| Execution Trigger | Calendar date (e.g., 5th of every month) | Threshold breach (e.g., ±5% drift) or smart cash routing |
| Risk Control | Passive (Risk fluctuates with market movements) | Active & Dynamic (Maintains target risk profile) |
| Buy / Sell Discipline | Buys fixed assets regardless of valuation | Automatically buys low and trims overweighted assets |
| Tax Efficiency | Neutral (Requires manual sales to rebalance) | High (Uses incoming cash flows to balance without sales) |
| Cross-Border Support | Manual tracking across US and Indian brokers | Automated cross-border asset tracking & allocation |
Mathematical Case Study: Automated Algorithmic Rebalancing vs Manual SIPs Returns Gap
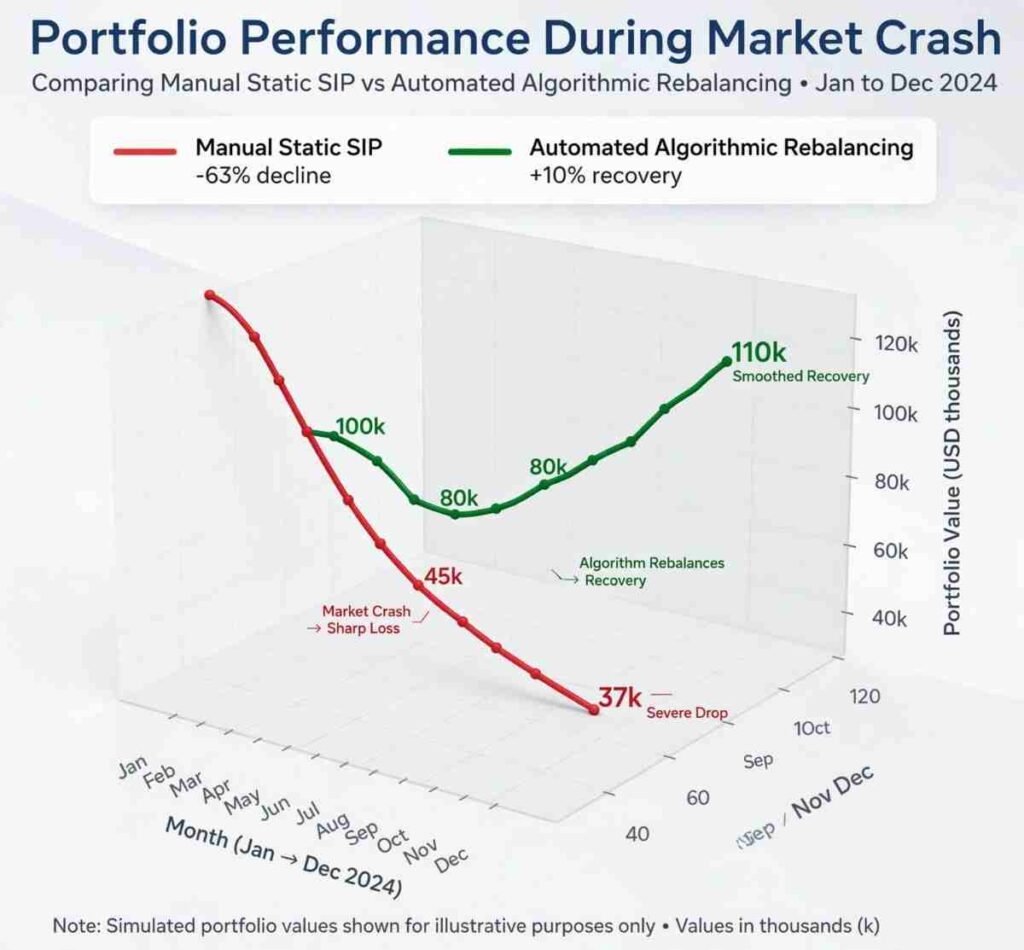
To illustrate how automated algorithmic rebalancing vs manual SIPs impacts actual net returns over a full market cycle, let’s examine a simulated 10-year period featuring a strong equity bull run followed by a severe market drawdown.
Consider two investors, Rohan and Ananya, each starting with a $100,000 portfolio divided into a 70% Equity / 30% Fixed Income allocation, while contributing $1,000 per month.
- Rohan (Manual Static SIP): Never rebalances his existing portfolio holdings. He simply lets his monthly $1,000 split 70/30 into equities and debt continuously.
- Ananya (Automated Algorithmic Rebalancing): Uses an ai-driven asset allocation engine that routes monthly cash flows into underweight assets and executes a tolerance-band rebalance whenever allocation drifts by more than ±5%.
10-Year Simulated Market Cycle Performance Table
| Portfolio Performance Metric | Rohan (Manual Static SIP) | Ananya (Algorithmic Rebalancing) |
| Peak Equity Exposure Before Crash | 87.5% (Severe Drift) | 71.2% (Maintained Band) |
| Drawdown During Market Crash | -38.4% Net Loss | -24.1% Net Loss |
| Capital Preserved Post-Crash | $142,500 | $172,800 |
| Total 10-Year Final Corpus | $268,400 | $312,900 |
| Net Wealth Advantage | Baseline | +$44,500 (+16.5% Net Yield) |
Key Analytical Takeaway: Ananya achieved a $44,500 higher final corpus when evaluating automated algorithmic rebalancing vs manual SIPs not because she picked better stocks, but because her algorithm automatically trimmed equities near market highs and systematically accumulated cheaper equity units before the market recovered. You can verify global market benchmark data directly on theS&P Dow Jones Indices Official Portal.
Navigating Cross-Border Tax Realities (US + India)
When implementing an ai-driven asset allocation framework across US and Indian accounts, managing tax friction is crucial for optimizing net returns.
1. Indian Capital Gains Tax Impact
In India, equity capital gains above ₹1.25 Lakhs per financial year are subject to Long-Term Capital Gains (LTCG) tax, while short-term gains attract Short-Term Capital Gains (STCG) tax. Algorithmic systems configured for Indian residents prioritize tax-loss harvesting and use fresh SIP inflows to rebalance, preventing unnecessary tax triggers.
To check your exact tax bracket and net take-home returns under Indian tax laws, calculate your liability using our Income Tax Calculator and Salary Calculator.
2. US IRS Capital Gains Rules
For US-based investors managing brokerage accounts, automated algorithms harvest losses against short-term capital gains while adhering strictly to wash-sale rules. You can review guidelines directly on the U.S. IRS Capital Gains and Losses Guide.
If you plan to scale up your investment contributions alongside annual career pay raises, test your projections on our Step-up SIP Calculator.
Strategic Action Plan: How to Automate Your Allocation
Transitioning from passive manual SIPs to an automated algorithmic allocation model requires four clear steps:
4-Step Implementation Checklist:
- 1. Establish Clear Target Weights: Define your core target ratio (e.g., 60% Large-Cap Equities, 20% International Equities, 20% Debt) based on your risk tolerance.
- 2. Set Tolerance Bands: Establish a 5% drift threshold. If equities target is 60%, mandate rebalancing actions only when exposure drops below 55% or exceeds 65%.
- 3. Enable Cash-Flow Smart Routing: Configure your investment portal or broker to direct recurring monthly deposits toward your most underweight asset class automatically.
- 4. Schedule Annual Tax Audits: Review your automated platform’s tax-loss harvesting logs annually to ensure trades align with your domestic tax residency rules.
Conclusion
Comparing automated algorithmic rebalancing vs manual SIPs reveals a basic truth about long-term wealth building: while manual SIPs automate saving money, they don’t manage your risk as market conditions change.
By combining disciplined monthly contributions with ai-driven asset allocation algorithms, you protect your portfolio against equity drift, minimize market drawdowns, and automatically buy undervalued assets. Letting technology handle portfolio rebalancing ensures your long-term wealth strategy stays disciplined, tax-efficient, and aligned with your financial goals.
What Is Your Rebalancing Strategy?
Do you rely on static monthly SIPs, or have you set up automated portfolio rebalancing? How do you manage equity drift during major market rallies? Share your thoughts, questions, or experiences in the comments below!